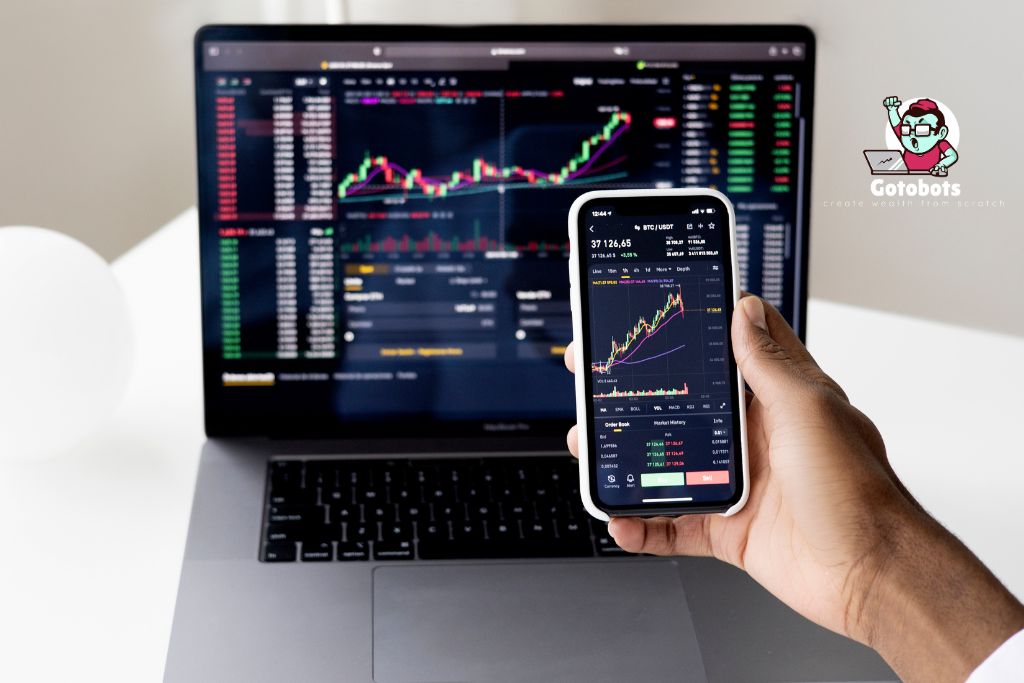
Ever wish you had a heatmap to visualize where trading opportunities are heating up? That’s exactly what our AI Signal Heatmap Grid does — and it can change how you spot and prioritize trades.
What is a Signal Heatmap?
It’s a real-time matrix that shows the strength of AI signals across multiple pairs and timeframes. Each block is color-coded to indicate:
- Signal strength
- Model confidence
- Trend direction or reversal probability
Why It Matters
- Avoid scanning hundreds of charts manually
- Instantly identify where AI sees the highest potential
- Filter by timeframe, asset class, or confidence zone
How to Use It
- In Strategy Builder: Inject top heatmap signals directly into bot triggers
- In Portfolio View: Visualize where current holdings rank
- For Manual Trades: Use it as a trade radar
Signal heatmaps are the radar your strategy never had. Start trading with visual clarity.


